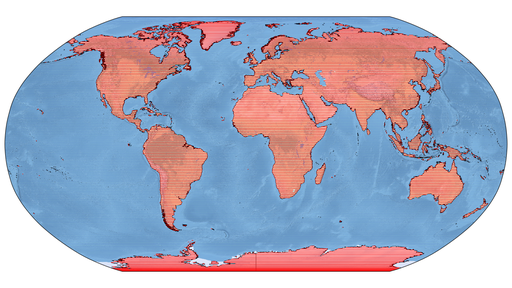
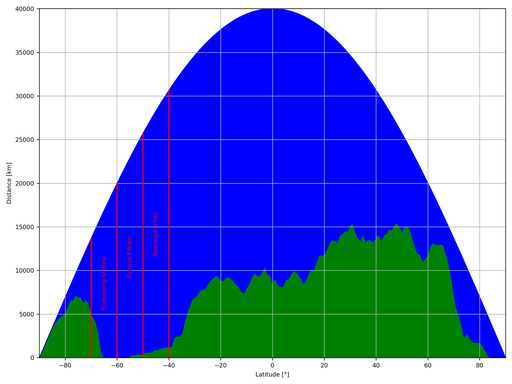
  1
  2
  3
  4
  5
  6
  7
  8
  9
 10
 11
 12
 13
 14
 15
 16
 17
 18
 19
 20
 21
 22
 23
 24
 25
 26
 27
 28
 29
 30
 31
 32
 33
 34
 35
 36
 37
 38
 39
 40
 41
 42
 43
 44
 45
 46
 47
 48
 49
 50
 51
 52
 53
 54
 55
 56
 57
 58
 59
 60
 61
 62
 63
 64
 65
 66
 67
 68
 69
 70
 71
 72
 73
 74
 75
 76
 77
 78
 79
 80
 81
 82
 83
 84
 85
 86
 87
 88
 89
 90
 91
 92
 93
 94
 95
 96
 97
 98
 99
100
101
102
103
104
105
106
107
108
109
110
111
112
113
114
115
116
117
118
119
120
121
122
123
124
125
126
127
128
129
130
131
132
133
134
135
136
137
138
139
140
141
142
143
144
145
146
147
148
149
150
151
152
153
154
155
156
157
158
159
160
161
162
163
164
165
166
167
168
169
170
171
172
173
174
175
176
177
178
179
180
181
182
183
184
185
186
187
188
189
190
191
192
193
194
195
196
197
198
199
200
201
202
203
204
205
206
207
208
209
210
211
212
213
214
215
216
217
218
219
220
221
222
223
224
225
226
227
228
229
230
231
232
233
234
235
236
237
238
239
240
241
242
243
244
245
246
247
248
249
250
251
252
253
254
255
256
257
258
259
260
261
262
263
264
265
266
267
268
269
270
271
272
273
274
275
276
277
278
279
280
281
282
283
284
285
286
287
288
289
290
291
292
293
294
295
296
297
298
299
300
301
302
303
304
305
306
307
308
309
310
311
312
313
314
315
316
317
318
319
320
321
322
323
324
325
326
327
328
329
330
331
332
333
334
335
336
337
338
339
340
341
342
|
#!/usr/bin/env python3

# Define function ...
def circumferenceAtLatitude(usrLat, /):
    """Find the circumference of the Earth at a given latitude

    This function finds the circumference (in metres) of the Earth at a given
    latitude (in degrees).

    Parameters
    ----------
    usrLat : float, numpy.ndarray
        the latitude (in degrees)

    Returns
    -------
    usrCir : float, numpy.ndarray
        the circumference of the Earth (in metres)

    Notes
    -----

    Copyright 2017 Thomas Guymer [1]_

    References
    ----------
    .. [1] PyGuymer3, https://github.com/Guymer/PyGuymer3
    """

    # Import special modules ...
    try:
        import numpy
    except:
        raise Exception("\"numpy\" is not installed; run \"pip install --user numpy\"") from None

    # Import my modules ...
    try:
        import pyguymer3
    except:
        raise Exception("\"pyguymer3\" is not installed; run \"pip install --user PyGuymer3\"") from None

    # Return answer ...
    return 2.0 * numpy.pi * pyguymer3.RADIUS_OF_EARTH * numpy.sin(numpy.radians(90.0 - usrLat))

# Define function ...
def degreesOfLongitude2Metres(usrLon, usrLat, /):
    """Find the length of a line of longitude at a given latitude

    This function finds the length (in metres) of a line of longitude (in
    degrees) on the surface of the Earth at a given latitude (in degrees).

    Parameters
    ----------
    usrLon : float
        the length of the line of longitude (in degrees)
    usrLat : float
        the latitude of the line of longitude (in degrees)

    Returns
    -------
    usrLen : float
        the length of the line of longitude (in metres)

    Notes
    -----

    Copyright 2017 Thomas Guymer [1]_

    References
    ----------
    .. [1] PyGuymer3, https://github.com/Guymer/PyGuymer3
    """

    # Return answer ...
    return (usrLon / 360.0) * circumferenceAtLatitude(usrLat)

# Use the proper idiom in the main module ...
# NOTE: See https://docs.python.org/3.12/library/multiprocessing.html#the-spawn-and-forkserver-start-methods
if __name__ == "__main__":
    # Import standard modules ...
    import os

    # Import special modules ...
    try:
        import cartopy
        cartopy.config.update(
            {
                "cache_dir" : os.path.expanduser("~/.local/share/cartopy_cache"),
            }
        )
    except:
        raise Exception("\"cartopy\" is not installed; run \"pip install --user Cartopy\"") from None
    try:
        import matplotlib
        matplotlib.rcParams.update(
            {
                       "backend" : "Agg",                                       # NOTE: See https://matplotlib.org/stable/gallery/user_interfaces/canvasagg.html
                    "figure.dpi" : 300,
                "figure.figsize" : (9.6, 7.2),                                  # NOTE: See https://github.com/Guymer/misc/blob/main/README.md#matplotlib-figure-sizes
                     "font.size" : 8,
            }
        )
        import matplotlib.pyplot
    except:
        raise Exception("\"matplotlib\" is not installed; run \"pip install --user matplotlib\"") from None
    try:
        import numpy
    except:
        raise Exception("\"numpy\" is not installed; run \"pip install --user numpy\"") from None
    try:
        import shapely
        import shapely.geometry
    except:
        raise Exception("\"shapely\" is not installed; run \"pip install --user Shapely\"") from None

    # Import my modules ...
    try:
        import pyguymer3
        import pyguymer3.geo
        import pyguymer3.image
    except:
        raise Exception("\"pyguymer3\" is not installed; run \"pip install --user PyGuymer3\"") from None

    # Create latitudes and arrays to hold results ...
    lats = numpy.linspace(90.0, -90.0, num = 181)                               # [°]
    landLensDeg = numpy.zeros(lats.size, dtype = numpy.float64)                 # [°]
    landLensMet = numpy.zeros(lats.size, dtype = numpy.float64)                 # [m]

    # Create figure ...
    fg = matplotlib.pyplot.figure(figsize = (12.8, 7.2))

    # Create axis ...
    ax = pyguymer3.geo.add_axis(fg)

    # Configure axis ...
    pyguymer3.geo.add_map_background(ax, resolution = "large8192px")

    # Find file containing all the country shapes ...
    sfile = cartopy.io.shapereader.natural_earth(
          category = "cultural",
              name = "admin_0_countries",
        resolution = "10m",
    )

    # Loop over latitudes ...
    for i in range(lats.size):
        # Catch the special cases of the poles ...
        # NOTE: The North Pole has no land; the South Pole has land (hence a
        #       full 360° in Geodetic space, which corresponds to only 0m in
        #       Euclidean space).
        if i == 0:
            landLensDeg[i] = 0.0                                                # [°]
            landLensMet[i] = 0.0                                                # [m]
            continue
        if i == lats.size - 1:
            landLensDeg[i] = 360.0                                              # [°]
            landLensMet[i] = 0.0                                                # [m]
            continue

        # Make grid line ...
        # HACK: Some of the regions go past 180 degrees (presumably due to
        #       floating-point rounding errors) so the grid line has to wrap
        #       around to ensure that it crosses at the anti-meridian.
        grid_line = shapely.geometry.LineString(
            [
                (-181.0, lats[i]),
                ( 181.0, lats[i]),
            ],
        )

        # Plot grid line ...
        ax.plot(
            [-180.0, 180.0],
            [lats[i], lats[i]],
                color = "blue",
            linewidth = 0.1,
            transform = cartopy.crs.PlateCarree(),
        )

        # Make stack of longitudes ...
        lons = numpy.empty(0, dtype = numpy.float64)                            # [°]

        # Loop over records ...
        for record in cartopy.io.shapereader.Reader(sfile).records():
            # Loop over Polygons ...
            for poly in pyguymer3.geo.extract_polys(record.geometry):
                # Find the Points which intersect the exterior ring and the grid
                # line ...
                points = pyguymer3.geo.extract_points(poly.exterior.intersection(grid_line))

                # Skip this intersection if there aren't any Points ...
                if len(points) == 0:
                    continue

                # Check that a sensible number of Points have been found ...
                if len(points) % 2 == 1:
                    print(f"WARNING: An odd number of Points was found at {lats[i]:.1f} (n = {len(points):d})")

                    # Loop over Points ...
                    for point in points:
                        # Extract coordinates ...
                        lon, lat = point.coords[0]                              # [°], [°]

                        # Add location to plot ...
                        ax.plot(
                            lon,
                            lat,
                                      color = "green",
                                     marker = "o",
                            markeredgewidth = 0.0,
                                 markersize = 1.0,
                                  transform = cartopy.crs.PlateCarree(),
                        )
                else:
                    # Loop over Points ...
                    for point in points:
                        # Extract coordinates and add to stack ...
                        lon, lat = point.coords[0]                              # [°], [°]
                        lons = numpy.append(lons, lon)                          # [°]

        # Skip if there aren't any intersections ...
        if lons.size == 0:
            continue

        # Sort array ...
        lons.sort()

        # Loop over longitude pairs ...
        for j in range(0, lons.size, 2):
            # Add length to total ...
            landLensDeg[i] += (lons[j + 1] - lons[j])                           # [°]

            # Plot length ...
            ax.plot(
                [lons[j], lons[j + 1]],
                [lats[i], lats[i]],
                    color = "red",
                linewidth = 1.0,
                transform = cartopy.crs.PlateCarree(),
            )

    # Populate array ...
    for i in range(1, lats.size - 1):
        landLensMet[i] = degreesOfLongitude2Metres(landLensDeg[i], lats[i])     # [m]

    # Configure figure ...
    fg.tight_layout()

    # Save figure ...
    fg.savefig("land_vs_latitude_map.png")
    matplotlib.pyplot.close(fg)

    # Optimize PNG ...
    pyguymer3.image.optimise_image(
        "land_vs_latitude_map.png",
        strip = True,
    )

    # **************************************************************************

    # Save data as CSV ...
    with open("land_vs_latitude.csv", "wt", encoding = "utf-8") as fObj:
        fObj.write("latitude [°],length of land [°],length of land [m]\n")
        for i in range(lats.size):
            fObj.write(f"{lats[i]:.15e},{landLensDeg[i]:.15e},{landLensMet[i]:.15e}\n")

    # **************************************************************************

    # Create figure ...
    fg = matplotlib.pyplot.figure()

    # Create axis ...
    ax = fg.add_subplot()

    # Plot data ...
    ax.fill_between(
        lats,
        numpy.zeros(lats.size, dtype = numpy.float64),
        landLensMet / 1.0e3,
        color = "green",
    )
    ax.fill_between(
        lats,
        landLensMet / 1.0e3,
        circumferenceAtLatitude(lats) / 1.0e3,
        color = "blue",
    )

    # Draw labels ...
    for lat in [-70.0, -60.0, -50.0, -40.0]:
        ax.plot(
            [lat, lat,],
            [0.0, circumferenceAtLatitude(lat) / 1.0e3,],
            color = "red",
        )
    ax.text(
        -65.0,
        0.5 * circumferenceAtLatitude(-65.0) / 1.0e3,
        "Screaming Sixties",
                      color = "red",
        horizontalalignment = "center",
                   rotation = "vertical",
          verticalalignment = "center",
    )
    ax.text(
        -55.0,
        0.5 * circumferenceAtLatitude(-55.0) / 1.0e3,
        "Furious Fifties",
                      color = "red",
        horizontalalignment = "center",
                   rotation = "vertical",
          verticalalignment = "center",
    )
    ax.text(
        -45.0,
        0.5 * circumferenceAtLatitude(-45.0) / 1.0e3,
        "Roaring Forties",
                      color = "red",
        horizontalalignment = "center",
                   rotation = "vertical",
          verticalalignment = "center",
    )

    # Configure axis ...
    ax.grid()
    ax.set_xlabel("Latitude [°]")
    ax.set_xlim(-90.0, +90.0)
    ax.set_ylabel("Distance [km]")
    ax.set_ylim(0.0, 2.0 * numpy.pi * pyguymer3.RADIUS_OF_EARTH / 1.0e3)

    # Configure figure ...
    fg.tight_layout()

    # Save figure ...
    fg.savefig("land_vs_latitude_plot.png")
    matplotlib.pyplot.close(fg)

    # Optimize PNG ...
    pyguymer3.image.optimise_image(
        "land_vs_latitude_plot.png",
        strip = True,
    )
|

