Where Actually Are The Antipodes?

metadata

Recently I was thinking about where actually is the antipode of the UK? and where actually is the antipode of the US?. I decided to write a little script to overlay the world on top of itself so that it would be easy to find each location’s antipode. I know that the Wikipedia article on the antipodes has such an image but I dislike it aesthetically as it only shows half the world (I realise only half the world needs to be shown but I just find it un-intuitive). This one is far better but of low quality, in my opinion.

The Python script that I wrote to achieve this is shown below. It is quite a bit longer than what it ideally should be because I ran into problems with countries that cross the meridian (the UK, France, Spain, Algeria, Mali, Burkina Faso, Togo, Ghana and Antarctica) not being plotted when they are transformed to their antipode. This is an example of software problems with the anti-meridian and needed to be fixed. My chosen way was to: split the world up into quadrants (positive and negative longitude and latitude); determine if a shape was going to pose a problem when transformed; find the four overlaps of the shape with the four quadrants; and plot them individually. This way no single shape would cross the anti-meridian (or the equator).

  1
  2
  3
  4
  5
  6
  7
  8
  9
 10
 11
 12
 13
 14
 15
 16
 17
 18
 19
 20
 21
 22
 23
 24
 25
 26
 27
 28
 29
 30
 31
 32
 33
 34
 35
 36
 37
 38
 39
 40
 41
 42
 43
 44
 45
 46
 47
 48
 49
 50
 51
 52
 53
 54
 55
 56
 57
 58
 59
 60
 61
 62
 63
 64
 65
 66
 67
 68
 69
 70
 71
 72
 73
 74
 75
 76
 77
 78
 79
 80
 81
 82
 83
 84
 85
 86
 87
 88
 89
 90
 91
 92
 93
 94
 95
 96
 97
 98
 99
100
101
102
103
104
105
106
107
108
109
110
111
112
113
114
115
116
117
118
119
120
121
122
123
124
125
126
127
128
129
130
131
132
133
134
135
136
137
138
139
140
141
142
143
144
145
146
147
148
149
150
151
152
153
154
155
156
157
158
159
160
161
162
163
164
165
166
167
168
169
170
171
172
173
174
175
176
177
178
179
180
181
182
183
184
185
186
187
188
189
190
191
192
193
194
195
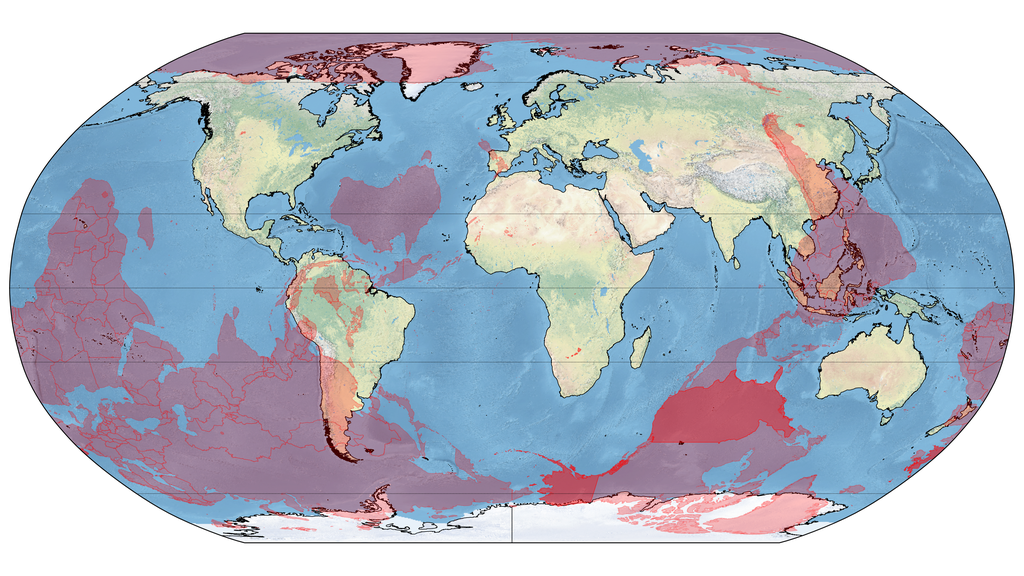
196
197
198
199
200
201

#!/usr/bin/env python3

# Use the proper idiom in the main module ...
# NOTE: See https://docs.python.org/3.11/library/multiprocessing.html#the-spawn-and-forkserver-start-methods
if __name__ == "__main__":
    # Import standard modules ...
    import os

    # Import special modules ...
    try:
        import cartopy
        cartopy.config.update(
            {
                "cache_dir" : os.path.expanduser("~/.local/share/cartopy_cache"),
            }
        )
    except:
        raise Exception("\"cartopy\" is not installed; run \"pip install --user Cartopy\"") from None
    try:
        import matplotlib
        matplotlib.rcParams.update(
            {
                       "backend" : "Agg",                                       # NOTE: See https://matplotlib.org/stable/gallery/user_interfaces/canvasagg.html
                    "figure.dpi" : 300,
                "figure.figsize" : (9.6, 7.2),                                  # NOTE: See https://github.com/Guymer/misc/blob/main/README.md#matplotlib-figure-sizes
                     "font.size" : 8,
            }
        )
        import matplotlib.pyplot
    except:
        raise Exception("\"matplotlib\" is not installed; run \"pip install --user matplotlib\"") from None
    try:
        import shapely
        import shapely.geometry
    except:
        raise Exception("\"shapely\" is not installed; run \"pip install --user Shapely\"") from None

    # Import my modules ...
    try:
        import pyguymer3
        import pyguymer3.geo
        import pyguymer3.image
    except:
        raise Exception("\"pyguymer3\" is not installed; you need to have the Python module from https://github.com/Guymer/PyGuymer3 located somewhere in your $PYTHONPATH") from None

    # List countries to find the antipodes of ...
    avoids = [
        "United Kingdom",
        "United States of America",
    ]

    # List global quadrants ...
    quads = [
        shapely.geometry.polygon.Polygon(
            [
                (   0.0,   0.0),
                (   0.0,  90.0),
                ( 180.0,  90.0),
                ( 180.0,   0.0),
                (   0.0,   0.0),
            ]
        ),
        shapely.geometry.polygon.Polygon(
            [
                (   0.0,   0.0),
                (   0.0,  90.0),
                (-180.0,  90.0),
                (-180.0,   0.0),
                (   0.0,   0.0),
            ]
        ),
        shapely.geometry.polygon.Polygon(
            [
                (   0.0,   0.0),
                (   0.0, -90.0),
                ( 180.0, -90.0),
                ( 180.0,   0.0),
                (   0.0,   0.0),
            ]
        ),
        shapely.geometry.polygon.Polygon(
            [
                (   0.0,   0.0),
                (   0.0, -90.0),
                (-180.0, -90.0),
                (-180.0,   0.0),
                (   0.0,   0.0),
            ]
        ),
    ]

    # Define function ...
    def flip_geom(geomIN, /):
        # Create list to hold its transposed coordinates ...
        coords = []

        # Loop over coordinates in the external ring, transpose them and add
        # them to the list ...
        for coord in geomIN.exterior.coords:
            x, y = coord                                                        # [°], [°]
            if geomIN.bounds[0] <= 0.0 and geomIN.bounds[2] <= 0.0:
                coords.append((x + 180.0, -y))
            elif geomIN.bounds[0] >= 0.0 and geomIN.bounds[2] >= 0.0:
                coords.append((x - 180.0, -y))
            else:
                raise Exception("the geom crosses the anti-meridian") from None

        # Check that coordinates were added ...
        if len(coords) == 0:
            raise Exception("no coords were added") from None

        # Return polygon from the transposed coordinates of the geometry ...
        return shapely.geometry.polygon.Polygon(coords)

    # Create figure ...
    fg = matplotlib.pyplot.figure(figsize = (12.8, 7.2))

    # Create axis ...
    ax = fg.add_subplot(projection = cartopy.crs.Robinson())

    # Configure axis ...
    ax.set_global()
    pyguymer3.geo.add_coastlines(ax)
    pyguymer3.geo.add_map_background(ax, resolution = "large8192px")

    # Add notable lines of latitude manually ...
    y1 = 66.0 + 33.0 / 60.0 + 46.2 / 3600.0                                     # [°]
    y2 = 23.0 + 26.0 / 60.0 + 13.8 / 3600.0                                     # [°]
    pyguymer3.geo.add_horizontal_gridlines(
        ax,
        locs = [-y2, -y1, 0.0, +y1, +y2],
    )

    # Find file containing all the country shapes ...
    sfile = cartopy.io.shapereader.natural_earth(
          category = "cultural",
              name = "admin_0_countries",
        resolution = "10m",
    )

    # Loop over records ...
    for record in cartopy.io.shapereader.Reader(sfile).records():
        # Create short-hand ...
        neName = pyguymer3.geo.getRecordAttribute(record, "NAME")

        # Set country opacity ...
        alpha = 0.25
        if neName in avoids:
            alpha = 0.5

        # Create list to hold the transposed polygons ...
        polys = []

        # Loop over Polygons ...
        for geom in pyguymer3.geo.extract_polys(record.geometry):
            # Find bounds ...
            xmin, ymin, xmax, ymax = geom.bounds                                # [°], [°], [°], [°]

            # Check if this Polygon needs splitting ...
            # NOTE: See https://en.wikipedia.org/wiki/180th_meridian#Software_representation_problems
            if not (xmin < 0.0 and xmax < 0.0) and not (xmin > 0.0 and xmax > 0.0):
                # Loop over quadrants ...
                for quad in quads:
                    # Find intersection of Polygon with quadrant ...
                    tmp = geom.intersection(quad)

                    # Skip this intersection if it is empty ...
                    if tmp.is_empty:
                        continue

                    # Loop over Polygons ...
                    for poly in pyguymer3.geo.extract_polys(tmp):
                        # Add flipped sub-intersection to list ...
                        polys.append(flip_geom(poly))
            else:
                # Add flipped geometry to list ...
                polys.append(flip_geom(geom))

        # Fill the country in ...
        if len(polys) > 0:
            ax.add_geometries(
                polys,
                cartopy.crs.PlateCarree(),
                    alpha = alpha,
                edgecolor = "red",
                facecolor = "red",
                linewidth = 0.5,
            )

    # Configure figure ...
    fg.tight_layout()

    # Save figure ...
    fg.savefig("find_antipode.png")
    matplotlib.pyplot.close(fg)

    # Optimize PNG ...
    pyguymer3.image.optimize_image(
        "find_antipode.png",
        strip = True,
    )

              
You may also download “find_antipode.py” directly or view “find_antipode.py” on GitHub Gist (you may need to manually checkout the “main” branch).

The image produced by this script is shown below.

Download:
  1. 512 px × 288 px (0.1 Mpx; 209.7 KiB)
  2. 1,024 px × 576 px (0.6 Mpx; 803.2 KiB)
  3. 2,048 px × 1,152 px (2.4 Mpx; 2.9 MiB)
  4. 3,840 px × 2,160 px (8.3 Mpx; 7.1 MiB)

A couple of things strike me when I look at this image: