The Melting Baltic Sea
metadata
- keywords:
- published:
- updated:
- Atom Feed
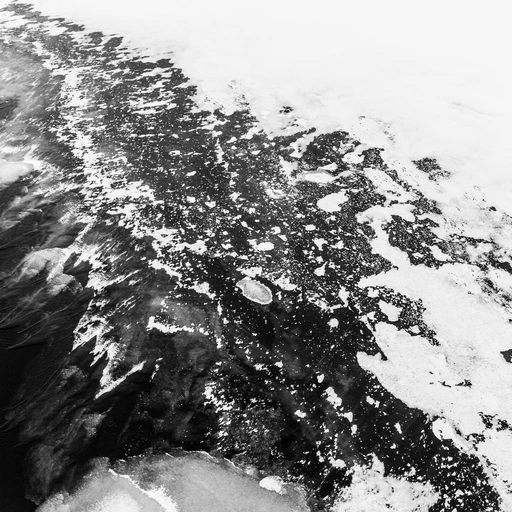
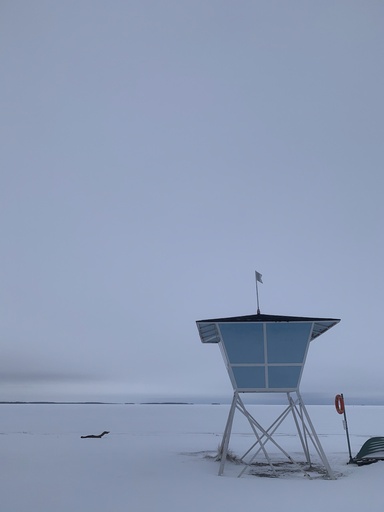 A year ago today I was visiting the city of Oulu in northern Finland, which is situated on the coast of the Gulf Of Bothnia (which itself is part of the Baltic Sea). I will always remember this day as it was the first day that I walked on the frozen sea. I had walked (and skied) on frozen lakes before, but this was my first time on the frozen sea. Each winter, an ice road is carved out to the island of Hailuoto to replace the normal (summer) ferry service. Indeed, Finland is well known for its ice roads.
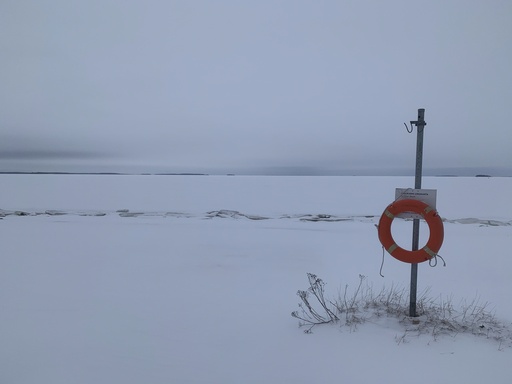
 I initially arrived in Helsinki before taking the train north to Oulu a few days later. At the time it was uncertain if the sea ice would be thick enough to walk (and drive) on as the local media was reporting that there was less sea ice than what is usual for late January. I was constantly refreshing the webpage of ice conditions from the Finnish Meteorological Institute. I became addicted to that webpage and I vowed to study the data in detail sometime.
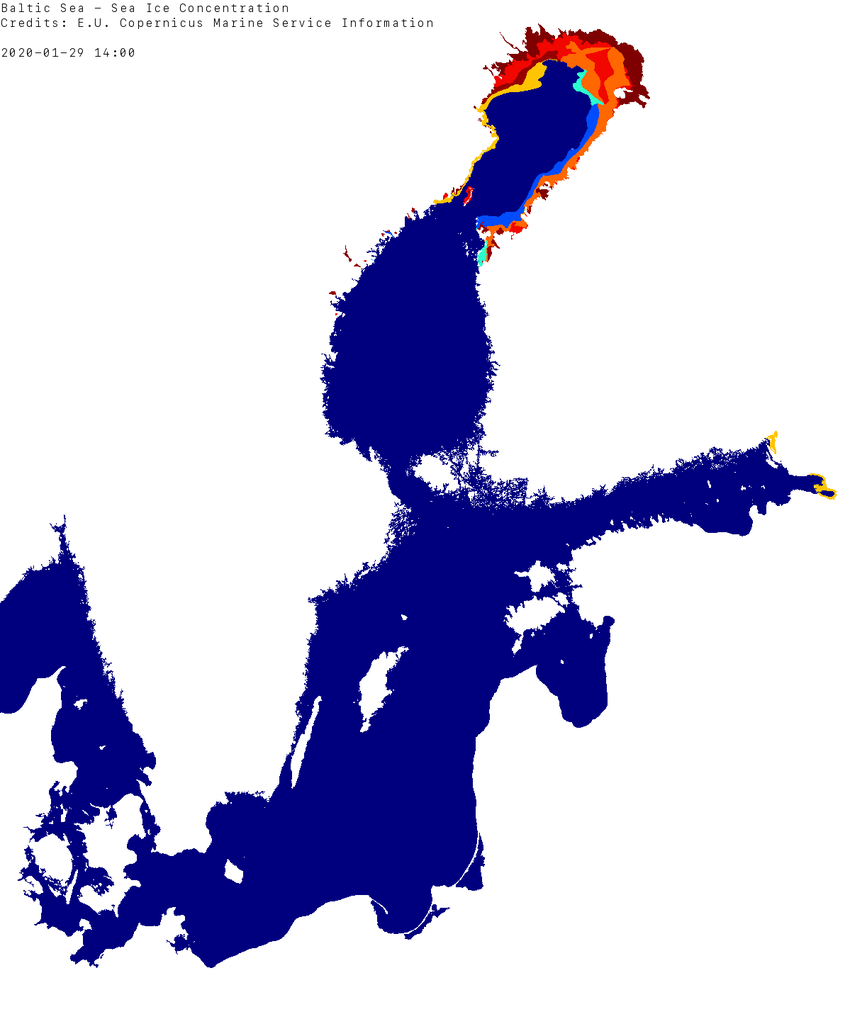
 I have since written a collection of Python scripts to study sea ice (currently just for the Baltic Sea). The Copernicus Marine Environment Monitoring Service (CMEMS) provides datasets of sea ice concentration and thickness obtained from Synthetic Aperture Radar (SAR) equipped satellites. Below is the data for the 29th of January last year. The large island of Hailuoto is clearly visible at the north-eastern end of the Gulf Of Bothnia.

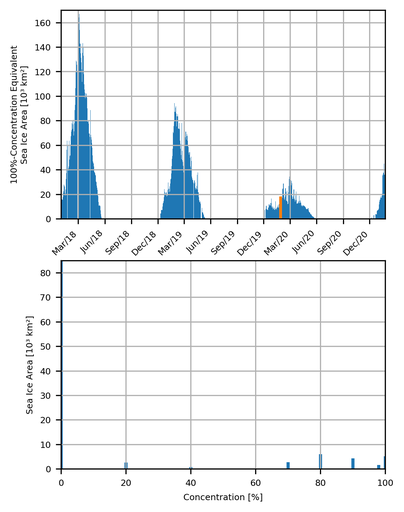
To investigate the local media’s claims about historical sea ice thicknesses I surveyed all of the available data: I not only created a histogram of sea ice concentration for a particular day, but I also calculated a “100%-concentration equivalent” sea ice area metric and plotted it over time, shown below. As you can see, the total area of (100%-concentration equivalent) sea ice (highlighted in orange in the upper plot) was about three times lower than what it had been on the same day the two previous years.
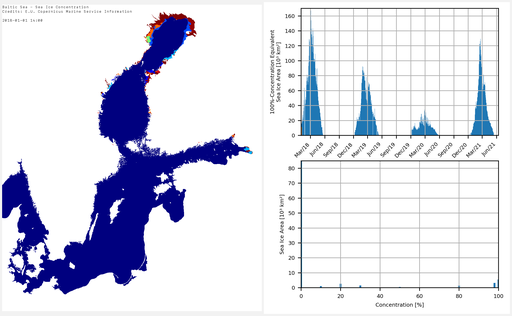
Not only that, but it turns out that the total area of (100%-concentration equivalent) sea ice has been significantly reducing each year. I decided to create an animation to fully illustrate this behaviour, which is shown below.
I will keep on downloading the “SEAICE_BAL_SEAICE_L4_NRT_OBSERVATIONS_011_004” dataset from CMEMS and I will keep on updating the above animation. Hopefully these past couple of years are just random anomalies, but I suspect that this is very real, and very simple, evidence of global warming. Maybe we will act now to halt the change … or maybe we will choose not to. As always, there is a relevant xkcd about this: Earth Temperature Timeline.