Adding Vector Map Underlays In Cartopy
metadata
- keywords:
- published:
- updated:
- Atom Feed
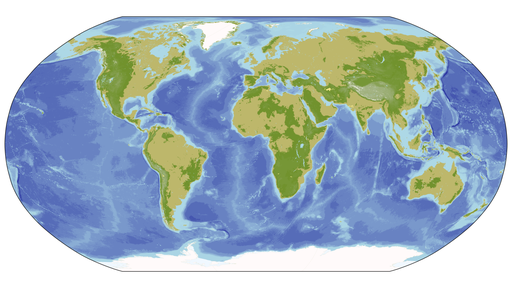
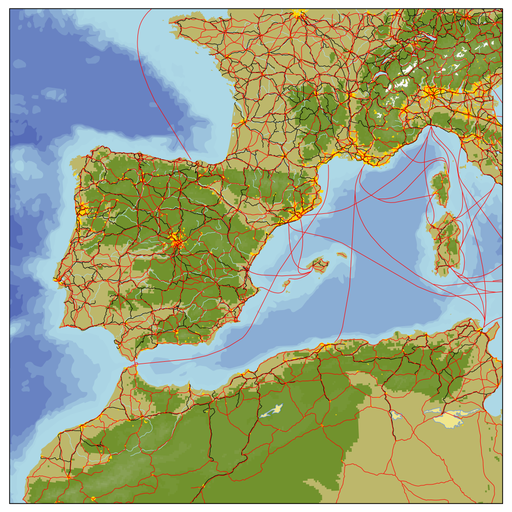
Recently I decided that I wanted map backgrounds which worked quickly over a variety of scales; I did not want to have to load a 21,600 px × 10,800 px image just to get green and blue backgrounds for the south coast of England. To this end I wrote a Python function called pyguymer3.geo.add_map_underlay()
which plots a variety of vector datasets from Natural Earth as well as the GeoJSON files from my previous blog post about vectorising the GLOBE dataset. It has the option too of plotting cultural datasets, such as railways and roads.
Below are three example images created by this function, showing a global extent, a local extent and an animation.


The three Pythonn scripts used to generate the above images are included below.
01: #!/usr/bin/env python3
02:
03: # Use the proper idiom in the main module ...
04: # NOTE: See https://docs.python.org/3.9/library/multiprocessing.html#multiprocessing-programming
05: if __name__ == "__main__":
06: # Import special modules ...
07: try:
08: import cartopy
09: except:
10: raise Exception("\"cartopy\" is not installed; run \"pip install --user Cartopy\"") from None
11: try:
12: import matplotlib
13: matplotlib.use("Agg") # NOTE: See https://matplotlib.org/stable/gallery/user_interfaces/canvasagg.html
14: import matplotlib.pyplot
15: except:
16: raise Exception("\"matplotlib\" is not installed; run \"pip install --user matplotlib\"") from None
17:
18: # Import my modules ...
19: try:
20: import pyguymer3
21: import pyguymer3.geo
22: import pyguymer3.image
23: except:
24: raise Exception("\"pyguymer3\" is not installed; you need to have the Python module from https://github.com/Guymer/PyGuymer3 located somewhere in your $PYTHONPATH") from None
25:
26: # **************************************************************************
27:
28: # Create figure and axis ...
29: fg = matplotlib.pyplot.figure(figsize = (12, 6), dpi = 300)
30: ax = fg.add_subplot(
31: 1,
32: 1,
33: 1,
34: projection = cartopy.crs.Robinson(),
35: )
36:
37: # Configure axis ...
38: ax.set_global()
39: pyguymer3.geo.add_map_underlay(ax, cultural = False, linewidth = 0.0, resolution = "10m")
40:
41: # Save, and close, figure ...
42: fg.savefig("addMapUnderlay_global.png", bbox_inches = "tight", dpi = 300, pad_inches = 0.1)
43: matplotlib.pyplot.close(fg)
44:
45: # Optimize PNG ...
46: pyguymer3.image.optimize_image("addMapUnderlay_global.png", strip = True)
47:
01: #!/usr/bin/env python3
02:
03: # Use the proper idiom in the main module ...
04: # NOTE: See https://docs.python.org/3.9/library/multiprocessing.html#multiprocessing-programming
05: if __name__ == "__main__":
06: # Import special modules ...
07: try:
08: import cartopy
09: except:
10: raise Exception("\"cartopy\" is not installed; run \"pip install --user Cartopy\"") from None
11: try:
12: import matplotlib
13: matplotlib.use("Agg") # NOTE: See https://matplotlib.org/stable/gallery/user_interfaces/canvasagg.html
14: import matplotlib.pyplot
15: except:
16: raise Exception("\"matplotlib\" is not installed; run \"pip install --user matplotlib\"") from None
17:
18: # Import my modules ...
19: try:
20: import pyguymer3
21: import pyguymer3.geo
22: import pyguymer3.image
23: except:
24: raise Exception("\"pyguymer3\" is not installed; you need to have the Python module from https://github.com/Guymer/PyGuymer3 located somewhere in your $PYTHONPATH") from None
25:
26: # **************************************************************************
27:
28: # Create figure and axis ...
29: fg = matplotlib.pyplot.figure(figsize = (12, 12), dpi = 300)
30: ax = fg.add_subplot(
31: 1,
32: 1,
33: 1,
34: projection = cartopy.crs.Orthographic(
35: central_longitude = 0.0,
36: central_latitude = 40.0,
37: ),
38: )
39:
40: # Configure axis ...
41: ax.set_extent(
42: [
43: -15.0, # left
44: 15.0, # right
45: 30.0, # bottom
46: 50.0, # top
47: ]
48: )
49: pyguymer3.geo.add_map_underlay(ax, resolution = "10m")
50:
51: # Save, and close, figure ...
52: fg.savefig("addMapUnderlay_local.png", bbox_inches = "tight", dpi = 300, pad_inches = 0.1)
53: matplotlib.pyplot.close(fg)
54:
55: # Optimize PNG ...
56: pyguymer3.image.optimize_image("addMapUnderlay_local.png", strip = True)
57:
001: #!/usr/bin/env python3
002:
003: # Use the proper idiom in the main module ...
004: # NOTE: See https://docs.python.org/3.9/library/multiprocessing.html#multiprocessing-programming
005: if __name__ == "__main__":
006: # Import standard modules ...
007: import os
008:
009: # Import special modules ...
010: try:
011: import cartopy
012: except:
013: raise Exception("\"cartopy\" is not installed; run \"pip install --user Cartopy\"") from None
014: try:
015: import matplotlib
016: matplotlib.use("Agg") # NOTE: See https://matplotlib.org/stable/gallery/user_interfaces/canvasagg.html
017: import matplotlib.pyplot
018: except:
019: raise Exception("\"matplotlib\" is not installed; run \"pip install --user matplotlib\"") from None
020: try:
021: import PIL
022: import PIL.Image
023: except:
024: raise Exception("\"PIL\" is not installed; run \"pip install --user Pillow\"") from None
025:
026: # Import my modules ...
027: try:
028: import pyguymer3
029: import pyguymer3.geo
030: import pyguymer3.image
031: except:
032: raise Exception("\"pyguymer3\" is not installed; you need to have the Python module from https://github.com/Guymer/PyGuymer3 located somewhere in your $PYTHONPATH") from None
033:
034: # Configure PIL to open images up to 1 GiP ...
035: PIL.Image.MAX_IMAGE_PIXELS = 1024 * 1024 * 1024 # [px]
036:
037: # **************************************************************************
038:
039: # Initialize list ...
040: fnames = []
041:
042: # Loop over longitudes ...
043: for ilon in range(-180, 180):
044: # Deduce longitude ...
045: lon = float(ilon) # [°]
046:
047: # Deduce filename, append it to list and skip this longitude if it
048: # already exists ...
049: fname = f"addMapUnderlay_animation_lon={lon:+08.3f}.png"
050: fnames.append(fname)
051: if os.path.exists(fname):
052: continue
053:
054: print(f"Making \"{fname}\" ...")
055:
056: # Create figure and axis ...
057: fg = matplotlib.pyplot.figure(figsize = (6, 6), dpi = 300)
058: ax = fg.add_subplot(
059: 1,
060: 1,
061: 1,
062: projection = cartopy.crs.NearsidePerspective(
063: central_longitude = lon,
064: central_latitude = 51.5,
065: ),
066: )
067:
068: # Configure axis ...
069: ax.set_global()
070: pyguymer3.geo.add_map_underlay(ax, cultural = False, linewidth = 0.0, resolution = "50m")
071:
072: # Save, and close, figure ...
073: fg.savefig(fname, bbox_inches = "tight", dpi = 300, pad_inches = 0.1)
074: matplotlib.pyplot.close(fg)
075:
076: # Optimize PNG ...
077: pyguymer3.image.optimize_image(fname, strip = True)
078:
079: # **************************************************************************
080:
081: print("Making \"addMapUnderlay_animation.webp\" ...")
082:
083: # Initialize list ...
084: images = []
085:
086: # Loop over frames ...
087: for fname in fnames:
088: # Open image as RGB (even if it is paletted) ...
089: image = PIL.Image.open(fname).convert("RGB")
090:
091: # Append it to the list ...
092: images.append(image)
093:
094: # Save 25fps WEBP ...
095: images[0].save("addMapUnderlay_animation.webp", lossless = True, quality = 100, method = 6, save_all = True, append_images = images[1:], duration = 40, loop = 0, minimize_size = True)
096:
097: # Clean up ...
098: for image in images:
099: image.close()
100: del images
101:
102: # **************************************************************************
103:
104: # Set heights ...
105: # NOTE: By inspection, the PNG frames are 1446px tall.
106: heights = [512, 1024] # [px]
107:
108: # Loop over heights ...
109: for height in heights:
110: print(f"Making \"addMapUnderlay_animation{height:04d}px.webp\" ...")
111:
112: # Initialize list ...
113: images = []
114:
115: # Loop over frames ...
116: for fname in fnames:
117: # Open image as RGB (even if it is paletted) ...
118: image = PIL.Image.open(fname).convert("RGB")
119:
120: # Calculate width ...
121: ratio = float(image.width) / float(image.height) # [px/px]
122: width = round(ratio * float(height)) # [px]
123:
124: # Downscale the image and append it to the list ...
125: images.append(image.resize((width, height), resample = PIL.Image.LANCZOS))
126:
127: # Save 25fps WEBP ...
128: images[0].save(f"addMapUnderlay_animation{height:04d}px.webp", lossless = True, quality = 100, method = 6, save_all = True, append_images = images[1:], duration = 40, loop = 0, minimize_size = True)
129:
130: # Clean up ...
131: for image in images:
132: image.close()
133: del images
134:
Enjoy!