The Melting Baltic Sea Update
metadata
- keywords:
- published:
- updated:
- Atom Feed
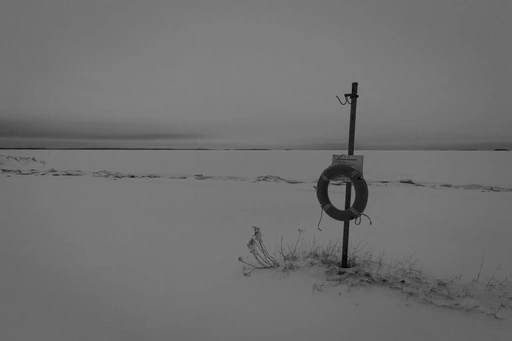
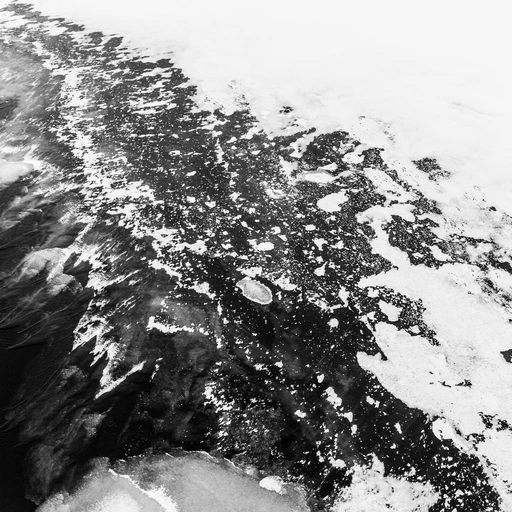 Two years ago I walked on the frozen sea just off the coast of Finland. Upon my return I vowed to analyse, and keep analysing, the data collected by the Copernicus Marine Environment Monitoring Service (CMEMS) of sea ice concentration and thickness which is obtained from Synthetic Aperture Radar (SAR) equipped satellites.
 One year ago I wrote a collection of Python scripts to study sea ice (currently just for the Baltic Sea) and I wrote a blog post about the melting Baltic Sea. I have updated my local collection of the “SEAICE_BAL_SEAICE_L4_NRT_OBSERVATIONS_011_004” dataset from CMEMS and I have re-run the Python scripts to regenerate the animation.
Now that I have data for a few years I have integrated the datasets to provide a yearly summary, which is shown below. Clearly 2020 (when I went) was a particularly bad year and since then 2021 and 2022 have both been better than 2020 (as well as 2019 to boot). I will continue to monitor this dataset and keep a track of the sea ice in the Baltic Sea.
| Year | Total 100%-Concentration Equivalent Sea Ice |
|---|---|
| 2018 | 9,647,999.0 km².day |
| 2019 | 5,957,851.9 km².day |
| 2020 | 2,068,896.7 km².day |
| 2021 | 7,266,678.6 km².day |
| 2022 | 6,327,817.8 km².day |
Note, the above table is “per calendar year” not “per winter”. We’ll call that “future work” …